Using Machine Learning for Cryptocurrency Analysis
- Simon Haile

- Jan 16, 2019
- 5 min read
Intro
Historically, cryptocurrencies have been seen as extremely volatile. This was seen last year in the dramatic increases of Bitcoin’s prices. Notably rising from approximately $6, 000 in November 2017 to $19, 000 December 2017, only to fall again in January 2018 to $11, 000. As of this writing, Bitcoin is even lower trading at about $3,600. However, when inspected hour to hour, the price changes are much less severe, easier to predict, and more adoptable
to traditional stock market analyses, such as technical indicators. This work aims to explore to what extent can we predict and classify hourly coin prices, technical indicators, and how well we can automate trading using these indicators.
Technical Indicators
This work considers three traditional financial stock market indicators: Bollinger Bonds (BB), the Chande Momentum Oscillator (CMO), and the Directional Momentum Index (DMI). While there are many well known technical indicators, we selected these because of their success shown in traditional stock market price trend estimation.
Bollinger Bands (BB) provide three values for a given price point:
A center point: moving average -in our case of- last 14 hours
An upper point: One standard deviation above the center
A lower point: One standard deviation below the center
Chande Momentum Oscillator (CMO) is calculated for each price point by determining the difference between the sum of all the recent gains and all the recent losses and dividing this difference by the sum of all price movement over the period. Recent is defined as the last 10 hour. Extreme values indicate overselling(-50) and overbuying(+50).
Directional Momentum Index (DMI) is a moving average indicator composed of three parts:
+DI, -DI: measure of an upwards and downwards price trend respectively.
ADX: Average directional index indicating the strength of +DI and -DI signals
Data
Hourly features for several crypto-coins are available through CoinAPI.io. We extracted
data for three coins with the most time data accessible: Bitcoin, Litecoin, and Ethereum. Each hour is annotated with six values related to the trading of the coins. These values include the closing and opening prices of the coins, the highest and lowest prices for the hour, the volume traded and the total count traded.

Decision Tree
Decision trees can be used as a classifier as well as a regressor via scikit-learn.
The python code example below shows how to build the regressor. After training,
the tree is used to predict the closing price of each coin after H hours, where H is
1, 10, or 24 hours into the future.

Regression experiments predicting the closing price for each coin are shown in the table below. The best results are achieved with Litecoin predicting the next hour, and the second
best is with Ethereum also predicting the next hour. However predicting Bitcoin prices does
not show good performance. This inconsistency maybe due to the differences in the amount
of hours available for each coin. The BTC dataset has about ten times more hours than the
others, which maybe a source of confusion for the model. Figure 1 below shows the tree
model's performance on the BTC data, and clearly illustrates how poorly the model predicts
for BTC over the last 5,000 hours. Running experiments using only the last quarter of data
for each coin corrects for this poor performance on BTC. While BTC has improved however,
the fewer data points cause performance to decline on the other coins.

Metrics and Predictions
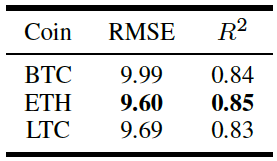
This table shows performance using the Coefficient of determination R2 and Root Mean Squared Error (RMSE) metrics.
R2 is a way to measure how heavily our inputs influence the outputs of our model. A perfect score of 1.0 expresses a strong influence. A score of 0.0 indicated a constant model, where the output is always the same regardless of the input. Negative scores are possible and indicate a poor system for modeling the behavior of the data.
RMSE is a measure of how closely the model can predict a real value attribute to the the true
value of that attribute. It can be thought of as answering the question: on average, how
far away are our predictions from the true values? The smaller the RMSE the better.

The table shows varying results for the three coins. This phenomenon suggests that the amount of data used in the prediction plays a role in how accurately we can predict prices.
Contrary to the intuition of data hungry machine learning models, reducing the number of data points for BTC to a quarter actually improves performance. However, the following table also suggests that there is a lower limit on the number of data points. We see below that using a quarter of our data for ETH and LTC makes our RMSE worse.

The task of predicting the value of technical indicators for the next hour also shows some interesting results. The results below are for predictions made about the next hour since that's the task with the best performance.

Bollinger Bands track fairly closely with price predictions. This is to be expected since the bands are based on a moving average of prices. Therefore the band values track closely with the value of prices. Again we see here that BTC large data set performs poorly.
CMO values are expected to oscillate between -50 and + 50. The RMSE of 10 is reasonable but perhaps not actionable information on it's own. Nonetheless, since this indicator is used
to monitor extreme values (overselling and overbuying) this RMSE is acceptable if used properly.

The RMSE values for +DI and -DI show good performance as well. Since the two values (+DI and -DI) are used to predict price trend (upward or downward) these are again acceptable RMSEs. The figure below plots how +DI and -DI are used to predict price trend.

We can use the above figure in the following ways. When the red is above the blue, we expect an upward price trend. When the blue is above the red we expect a downward price trend. We will see below the result of using this information for automated trading.
Automated Trading
Using the technical indicators discussed as signals, we performed automated trading for every hour of the data set. The duration of total trading time depends on the cryptocurrency being traded. Trading was automated for the previous six years, five months, and seven months for Bitcoin, Ethereum, and Litecoin respectively. We began each automated trading session with $100 and 100 coins. The final amounts after the trading duration was complete are summarized in the figure below. All of the data points were used in automated trading where at each hour, the indicators were used to either buy, sell, or stay.

Concluding Remarks
By introducing traditional stock market technical indicators to the cryptocurrency market, we see that we can successfully model and predict changes in closing prices, CMO, DMI, and
Bollinger band indicators with Decision Trees. The results suggest that having more than 3, 000 hours but fewer than 50, 000 hours of price data produce the best models. We also see CMO and DMI as the top performers. For more on this work please drop me a line at:
simonyabowerk@gmail.com
To take a look at some of the code please checkout the repo:
https://github.com/simonyabo/cryptoai
Cheers,
Simon Y. Haile
References
[1] S. Nakamoto, “Bitcoin: A peer-to-peer electronic cash system,” 2008.
[2] J. Chu, S. Nadarajah, and S. Chan, “Statistical analysis of the exchange
rate of bitcoin,” PloS one, vol. 10, no. 7, p. e0133678, 2015.
[3] “Coinapi-cryptocurrency data api,” CoinAPI-Cryptocurrency Data API.
[4] H. S. Walia and J. W. Hearne, “Automating technical indicators in the
financial market,”
[5] S. Hochreiter and J. Schmidhuber, “Long short-term memory,” Neural
computation, vol. 9, no. 8, pp. 1735–1780, 1997.
[6] F. Pedregosa, G. Varoquaux, A. Gramfort, V. Michel, B. Thirion,
O. Grisel, M. Blondel, P. Prettenhofer, R.Weiss, V. Dubourg, J. Vanderplas,
A. Passos, D. Cournapeau, M. Brucher, M. Perrot, and E. Duchesnay,
“Scikit-learn: Machine learning in Python,” Journal of Machine
Learning Research, vol. 12, pp. 2825–2830, 2011.
Comments